Para materiais em pó, normalmente usamos um analisador de tamanho de partículas a laser (com base no princípio equivalente de espalhamento de luz) para testar suas características e distribuição de tamanho de partículas.
Geralmente, analisamos os resultados dos testes para determinar os valores de D50 e D90. Isso nos ajuda a avaliar o desempenho do material. Mas e se não houver análise por terceiros? Como podemos interpretar os dados nós mesmos?
Primeiro, vamos entender a distribuição do tamanho das partículas.
A distribuição do tamanho das partículas descreve como partículas de diferentes tamanhos são distribuídas em um pó. Ela também reflete a uniformidade do tamanho das partículas. Normalmente, é ilustrada de duas maneiras: distribuição de frequência (distribuição diferencial) e distribuição cumulativa.

Gráfico de Distribuição Diferencial
Distribuição Diferencial
Isso mostra a porcentagem de partículas em cada faixa de tamanho de partícula dentro de toda a população de partículas (conforme mostrado no gráfico acima).
A linha preta indica que partículas com tamanho de 0,4 μm representam 71 TP3T do total. A linha verde mostra que partículas de 1,05 μm representam 2,51 TP3T. No gráfico, podemos observar que o pó possui tamanhos de partículas variando de 0,1 μm a 15 μm. Partículas em torno de 0,4 μm e 3 μm predominam. A uniformidade das partículas não é muito boa — isso pode ser intencional. Pode ser devido à má dispersão, onde partículas menores se aglomeram para formar partículas maiores.
Distribuição Cumulativa
Isto mostra a porcentagem de partículas menores ou maiores que um determinado tamanho de partícula (distribuição integrada). Abaixo, um gráfico combinado das distribuições diferencial e cumulativa — a linha vermelha e o eixo y direito formam a distribuição cumulativa.
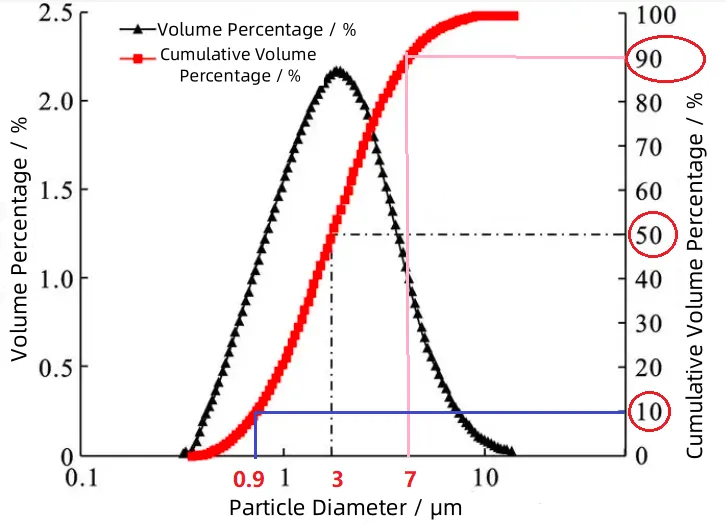
Gráfico de distribuição diferencial e de volume combinado
Vamos agora explicar a distribuição cumulativa, focando nos valores comumente vistos nos relatórios: D10, D50 e D90.
D10: Isso significa que 10% do volume da partícula é composto por partículas menores que esse tamanho. No gráfico, a linha azul mostra que 10% do volume total é composto por partículas menores que 0,9 μm.
D50: Também chamado de diâmetro mediano ou tamanho mediano de partícula, este é um valor típico que representa a distribuição do tamanho das partículas. Isso significa que 50% das partículas são maiores que esse tamanho, e 50% são menores. No gráfico, a linha tracejada preta mostra que partículas maiores e menores que 3 μm compõem 50%.
D90: Conforme indicado pela linha rosa, isso significa que 90% das partículas são menores que 7 μm, e assim por diante.
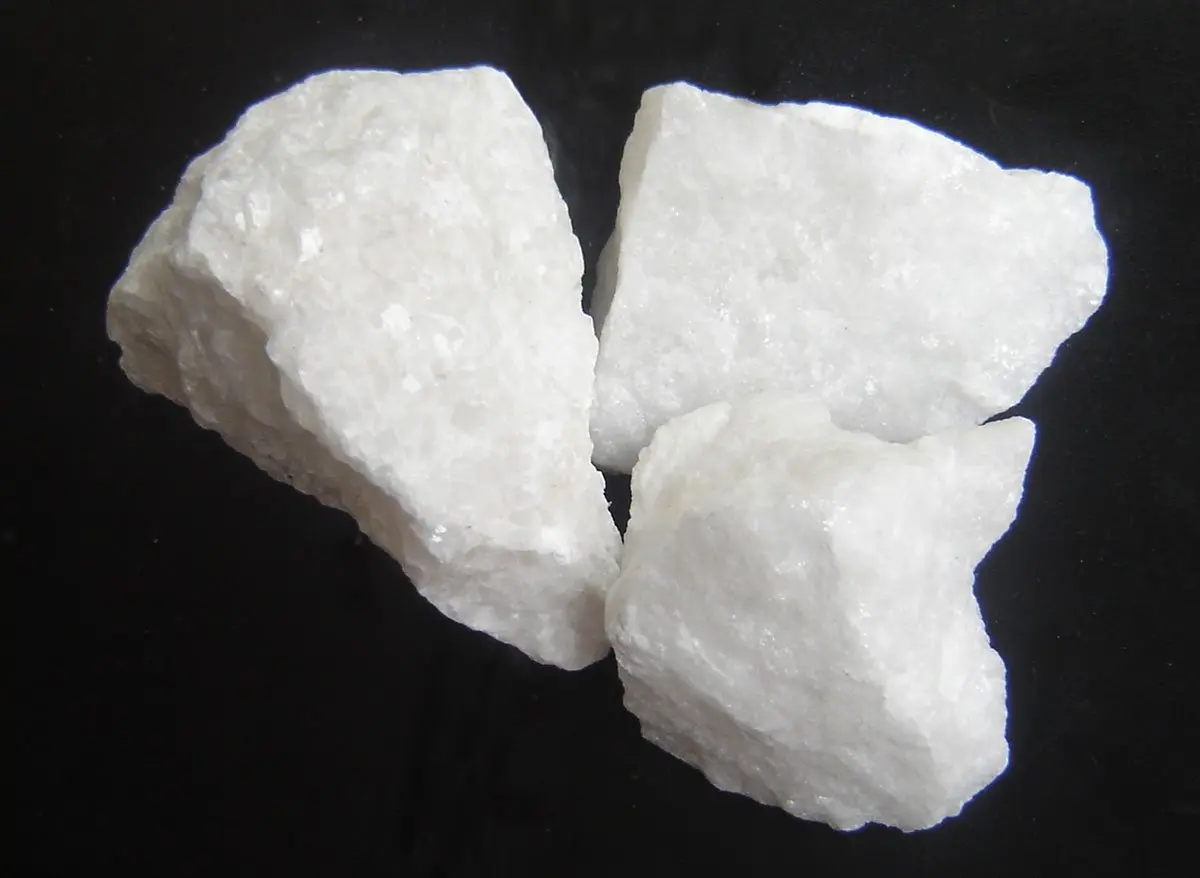
Embora o analisador de tamanho de partículas a laser seja muito prático e amplamente utilizado, ele também apresenta limitações. Para uma compreensão mais precisa do tamanho e da forma das partículas, precisamos utilizar a microscopia eletrônica de varredura (MEV) para observação e análise direta da morfologia e do tamanho das partículas do material.
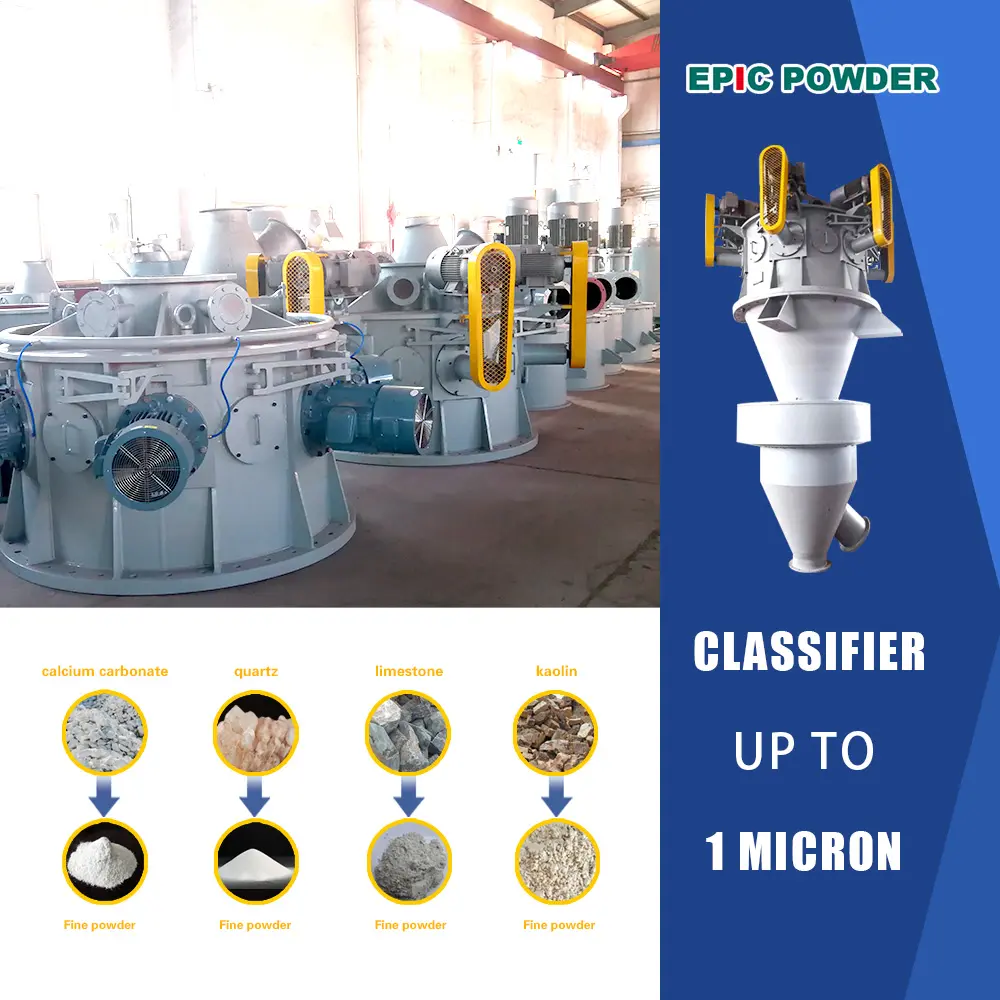
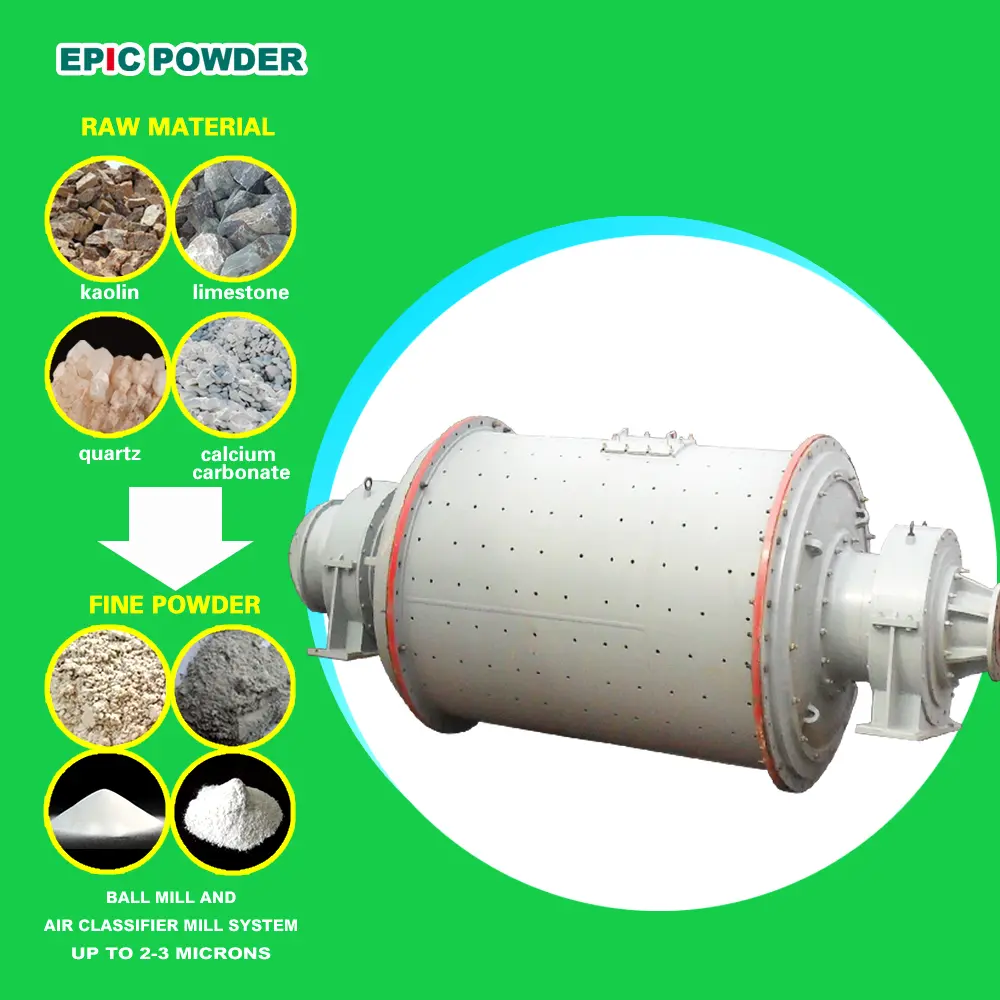
No Pó épico Máquinas, somos especializados em controle preciso do tamanho de partículas. Seja para distribuições estreitas ou valores D50 específicos, nossa moagem a jato avançada e classificação Os sistemas ajudam você a alcançar resultados consistentes e confiáveis. Fornecemos não apenas equipamentos, mas também profundo conhecimento em análise de partículas, ajudando os clientes a entender e otimizar as propriedades de seus pós para um melhor desempenho do produto.